
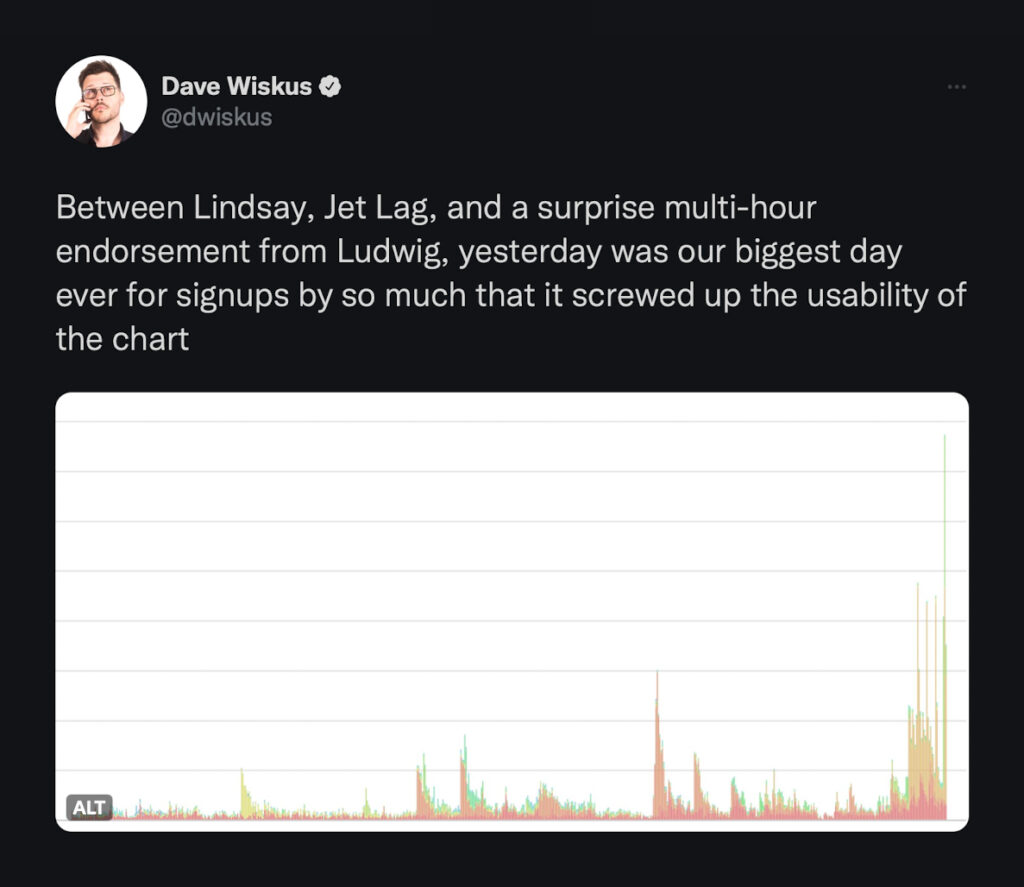
Not only was this our biggest day ever for signups, it was also our biggest day ever for traffic. In this post I’d like to give you a peek behind the curtain, to see how Jet Lag has impacted Nebula’s backend services, and to show you one of the tools we have at our disposal when things become too much to handle.
What we’re dealing with
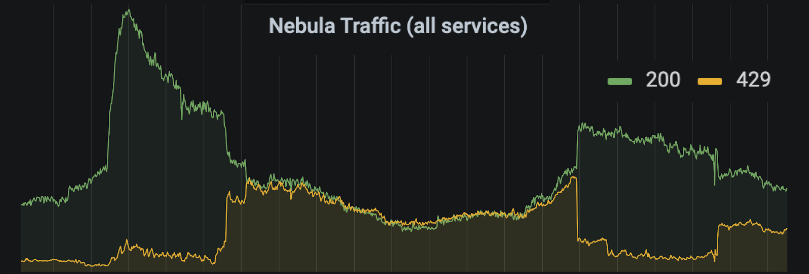
Here’s 30 days of combined traffic to all of our backend services, between September 25th and November 25th:

We see a clearly defined daily cycle, and then every Wednesday we have these large spikes. These are caused by Jet Lag episodes being released.
“How do you know they’re Jet Lag?”
The release of videos is something we keep a close eye on. If we zoom in on one of these spikes and turn on our push notification annotations, this is what we see:
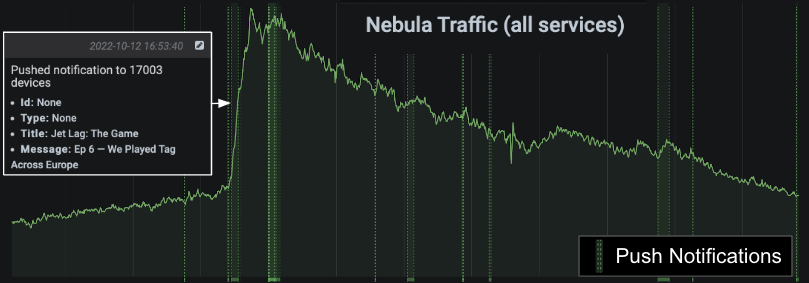
It looks quite dramatic, doesn’t it? What we see here is a ~3x increase in traffic to our backend services over the course of about 40 minutes. This is substantial, but not horrifying. I’d like to focus on two things we have in place for handling these spikes: autoscaling and rate limiting.
Autoscaling
The backend services that make up Nebula run on Kubernetes in AWS. Kubernetes is a container orchestration platform; you tell it what you want to run and it figures out how to do it. Explaining Kubernetes in detail is outside of the scope of this post, but if you’re interested the official website has a great overview: https://kubernetes.io/docs/concepts/overview/.
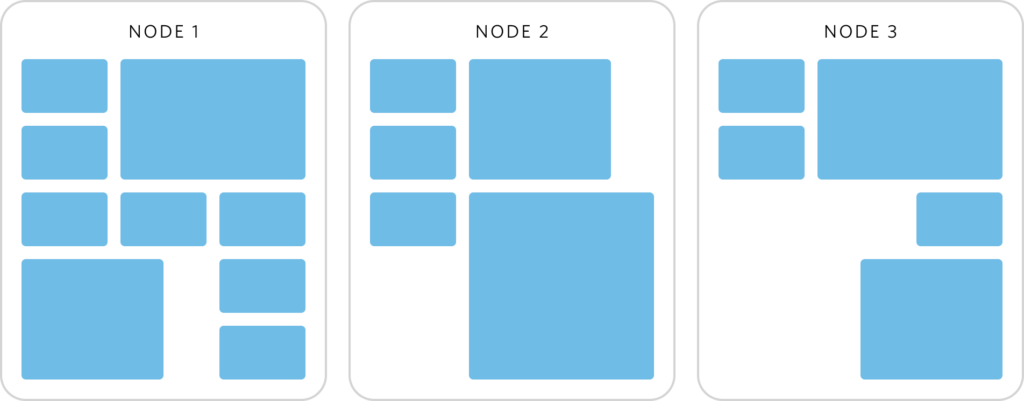
We make use of 2 different types of autoscaling: pod autoscaling, and node autoscaling. You can think of pods as independent units of work. Each pod can have multiple containers working together inside of it, and those containers have to run somewhere. This is where nodes come in. Nodes are computers that can run pods. In our case, EC2 instances. Pods additionally specify how much CPU, RAM, and disk they need, so you can also think of them as having different sizes depending on how much of each resource they need.
We have multiple types of pods for each of our services. The most important for this post is what we call “web” pods. These run the containers that handle web requests to our APIs, and each service has at least 3 of them. They contain application code to serve video data, handle signups of new users, create and cancel subscriptions, and so on. It’s these pods that have to absorb the 3x increase of traffic we see when a new Jet Lag episode drops.
Pod autoscaling
Pod autoscaling kicks in when a pod hits a threshold of resource utilization. Our web pod groups are configured to add in a new pod if the average CPU utilization of all pods is above 60%. We run a minimum of 3 web pods per service, for redundancy, and then we also configure a maximum in order to prevent excessive traffic from filling up our nodes and rendering other services unable to scale up.
Given that pods have a size, and a node can only run a finite number of pods, we also have…
Node autoscaling
Just like pods, nodes have a size. They have a finite amount of CPU, RAM, and disk space, and when they get full they won’t be able to run any more pods. For this reason, our Kubernetes cluster is also configured to add more nodes when it hits a threshold of utilization.
That was a lot of words. Let’s see how it works in practice.
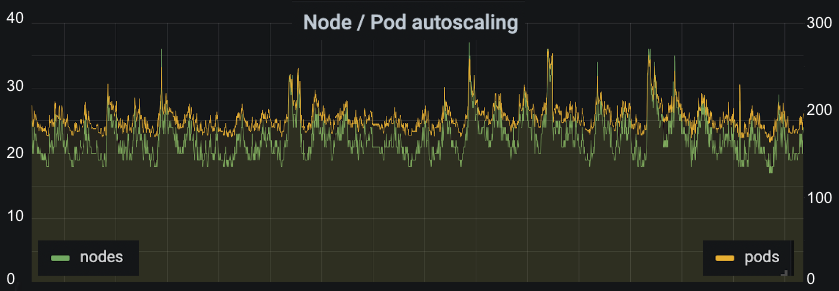
This is the same 30 day period we used earlier, only this time showing the number of nodes and pods present across all of our backend services. We can see it follows a similar daily cycle, with spikes in the same places we see spikes in traffic. At peak, we can see we’re using up to 37 nodes. This is double what we need at our quietest times. Autoscaling allows us to save money, as well respond automatically to bursts of traffic.
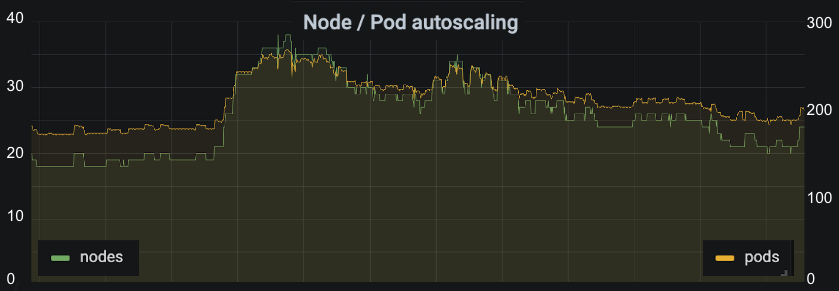
Zoomed in on one of the spikes, you can more clearly see autoscaling reacting to a Jet Lag episode being released. Doing this automatically frees us up from having to respond manually in most cases, only having to periodically tweak maximums in order to make sure we have plenty of headroom, accounting for organic growth. It’s a solid foundation upon which we can grow without being too wasteful.
Rate limiting
Sometimes autoscaling isn’t enough. We rely on relational databases, and each service has its own database. Unfortunately, one of the places where relational databases struggle is write scaling, and Nebula is a write-heavy workload.
“Wait, write-heavy? How is that the case?”
It’s a little surprising, isn’t it? Isn’t Nebula mostly about serving content to people? It is, but an important aspect of that is remembering where you got up to. All of our apps are periodically reporting your progress through our videos and podcasts, so that if you suddenly lose connection on one device you can seamlessly resume where you left off on another device. This traffic, at peak, makes up around 70% of all Nebula traffic.
One of the good things about this traffic is that, when push comes to shove, we don’t need to serve it. All of our apps are written such that progress is saved locally, and if requests to save that local progress don’t succeed, they are retried later. It’s not ideal to delay this progress syncing, but it’s a small price to pay to maintain stability of the rest of Nebula. This is a valuable pressure valve for us, and we have had to use it recently.
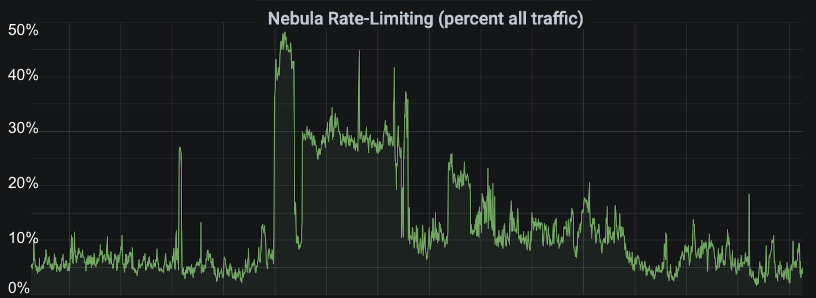
This graph shows the percentage of traffic we are rate limiting over the last 30 days. Our logs show that all of our rate limiting is done against progress reporting requests, and we have a fairly consistent background rate of 5-7% of requests being rate limited. We’re strict with the rate limit on progress reporting, because we know the apps handle being limited well, so we try to skirt close to the expected rate of requests at all times.
You can see a big section in the middle of this graph, though, where we’re rate limiting significantly more requests than normal. This was in response to Jet Lag episode 5. Here’s a close-up.
(Trivia: this was my birthday!) And to show why we responded the way we did, here’s a graph of our database CPU utilization and CPU credit balance over the same time period.
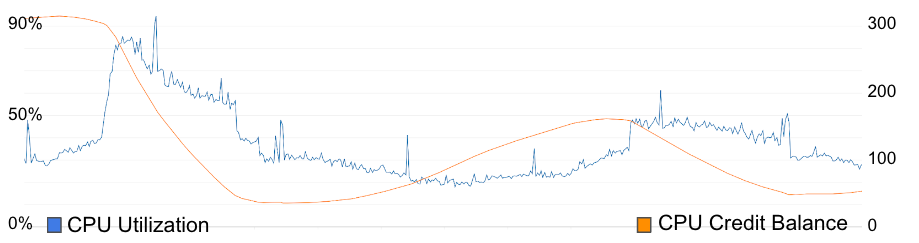
The credit balance falling triggered an automated alert, and our response was to make use of our ability to rate limit specific endpoints on-the-fly to start limiting video progress reporting. This relieves pressure on the database, and allows our credit balance to start refilling. CPU credits are a mechanism AWS use to allow you to have bursty CPU usage. Every second you’re above 50% CPU utilization, your credit balance goes down. Every second you’re below 50%, your credit balance goes up. When you hit 0, AWS either throttles you (really bad for us), or charges you more money (bad, but not as bad as throttling).
Since this happened, we’ve upgraded the size of our database instance for this service, and haven’t had to use this pressure valve since. The most recent episode of Jet Lag, episode 7, released and triggered no alerts, requiring no intervention from the backend team. Success!
The future
It’s at this point you may be thinking: “why write this directly to the database at all? Why not keep this in Redis or some other in-memory data store?”
This has crossed our minds. It’s likely that the long-term future of progress reporting on Nebula is to move to using something where writes are cheaper and easier to scale, but for now we get a lot of benefit from only using relational databases. Introducing something new is a serious decision, one that would have us considering monitoring, alerting, disaster recovery, the effect it will have on onboarding new team members, the added complexity of another moving part. For now, paying a bit more for a beefier database instance made the most sense.


